Annual report 2011
Statistical data in the report presented on the basis of web server and CMS Smereka statistics. Usage of Google analytics data noted separately.
Site volume
| Nodes | 970 |
| Attributes | 10511 |
| Data size | 7.26 Mb |
| Files | 332 |
| Files size | 58.22 Mb |
| Digital sheets | 216.71 |
[The number of digital sheets] = [number of nodes] / 1000 + [number of attributes] / 10000 + [Total volume of all attributes in bytes] / 40000 + [Total volume of files in MB] / 2.5
More
Dynamics of attendance by years
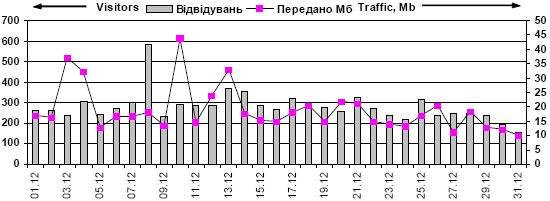
Dynamics of attendance in the 2011 year
There are total 88 702 visitors during year
The most successful month of the 2011 year – December

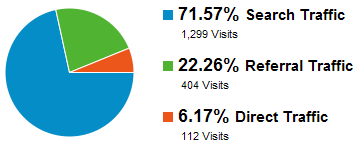
Traffic sources

According to Google analytics
Distribution of visitors by countries
| 1. | Ukraine | 83.36% |
| 2. | Russia | 6.17% |
| 3. | (not set) | 4.57% |
| 4. | Italy | 1.27% |
| 5. | United States | 0.94% |
| 6. | Belarus | 0.39% |
| 7. | Poland | 0.39% |
| 8. | Israel | 0.33% |
| 6. | Romania | 0.33% |
| 10. | Canada | 0.17% |
According to Google analytics
10 most requested documents
| 7.Language versions | 888 |
| News | 789 |
| Colloid science | 748 |
| Smereka | 689 |
| History | 606 |
| ITechnologies | 577 |
| 2002 | 530 |
| 1968 | 524 |
| Heritage | 507 |
| Gallery | 500 |
10 most requested search expression
| микола жарких | 77 |
| оформлення електронного видання | 62 |
| смерека это | 59 |
| что такое смерека | 58 |
| проблеми сучасної української культури | 58 |
| теория обратного осмоса | 57 |
| культ особи | 52 |
| Боротьба з мишами | 46 |
| Головлi | 36 |


